Install Grafana Operator on OpenShift Container Platform 4
-
 Abip Sjarbini
- Infrastructre & hardware, Grafana, Ocp4
- March 25, 2020
OpenShift Container Platform includes a pre-configured, pre-installed, and self-updating monitoring stack that is based on the Prometheus open source project and its wider eco-system. It provides monitoring of cluster components and includes a set of alerts to immediately notify the cluster administrator about any occurring problems and a set of Grafana dashboards. The cluster monitoring stack is only supported for monitoring OpenShift Container Platform clusters. and it is Read-Only. Means, Administrator can’t write custom queries, and create custom dashboards in Grafana.
(Image : @austindistel )
The support for modification and customization for the OpenShift Monitoring stack is limited. More details on this can be found in product documentation . As stated in documentation, modifying the monitoring stack Grafana instance is not supported.
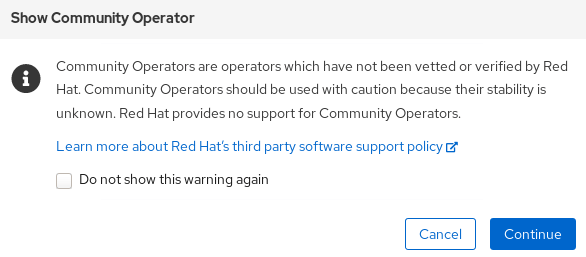
Community Operators are operators which have not been vetted or verified by Red Hat. Community Operators should be used with caution because their stability is unknown. Red Hat provides no support for Community Operators.
Through OperatorHub , Administrator can install Community Version of Grafana Operator and point the DataSource to the Prometheus.
Here, we are running OCP 4.3.3:
$ oc get clusterversion | grep version
version 4.3.3 True False 6h49m Cluster version is 4.3.3
We cannot install the Operator in the same namespace as Monitoring Stack, so we need to create a new project for it:
$ oc adm new-project grafana
Created project grafana
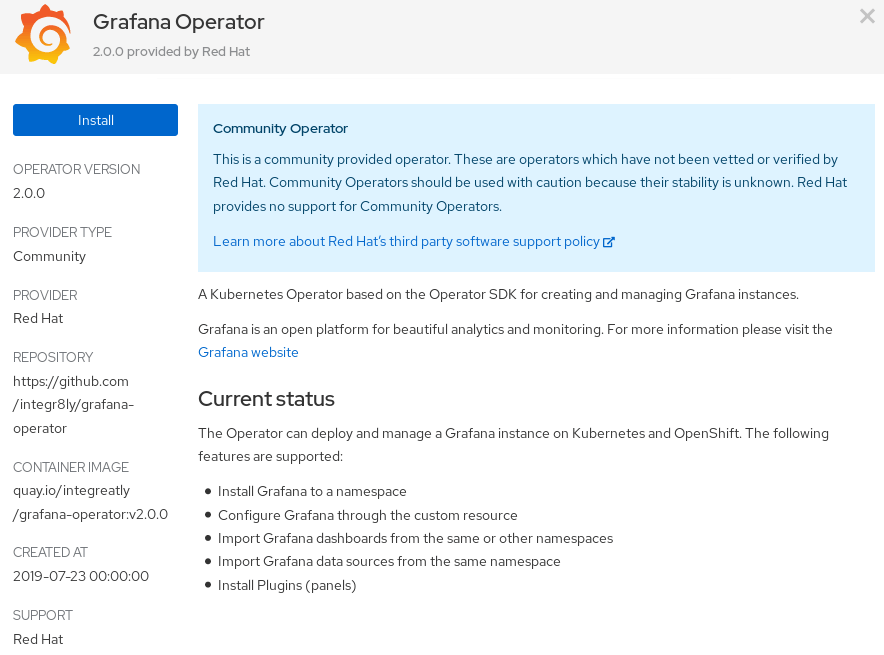
Login to the Console, as user with cluster-admin role, and: – Navigate to Operators :: OperatorHub – Type Grafana into the filter box to find Grafana Operator – Click Grafana Operator to display information about the Operator, You can learn about Red Hat’s 3rd Party Software Support Policy from the Notification Box. Click Continue
– Click Install to proceed
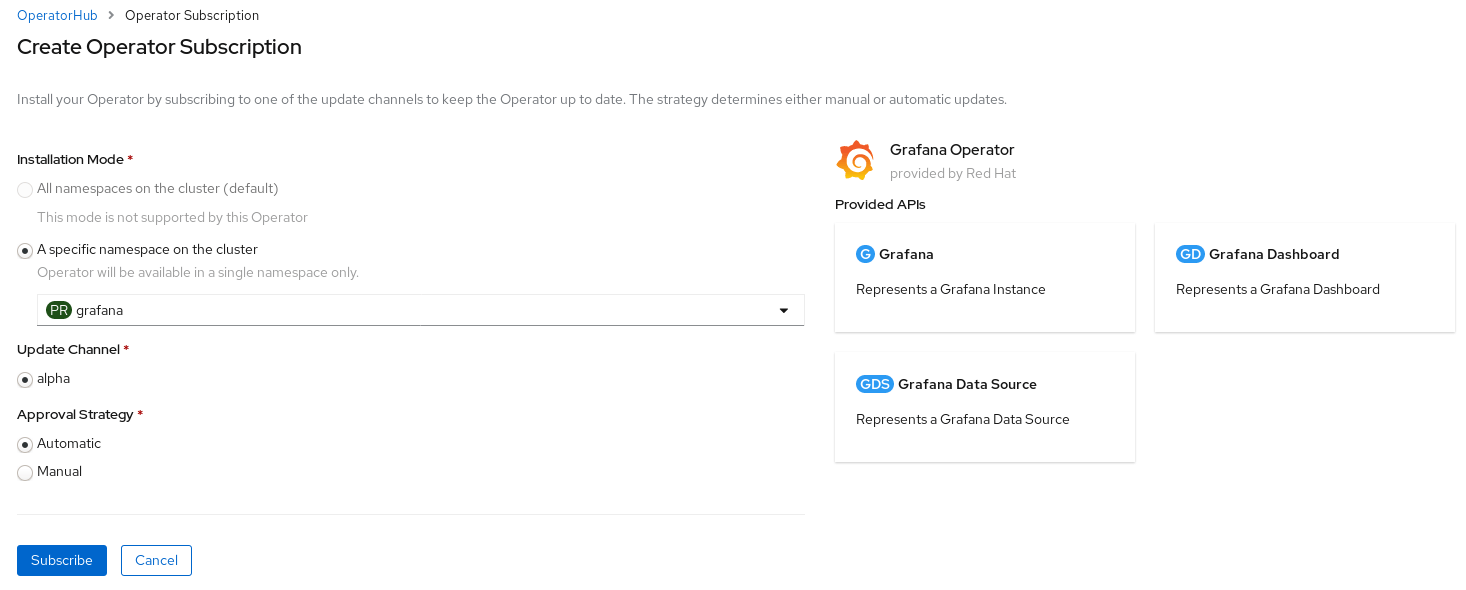
From Operator Subscription Page: – Choose A specific namespace on the cluster and select grafana – Select Automatic for Approval Strategy – Click Subscribe button
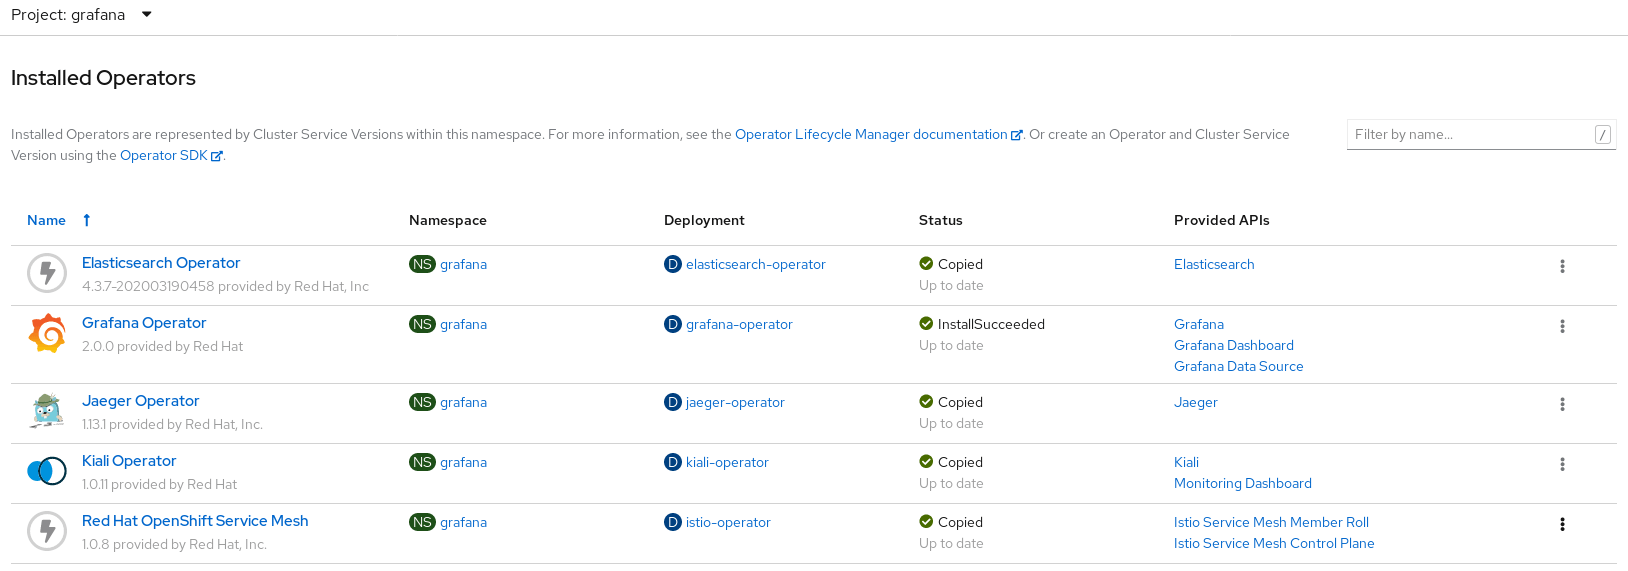
– Wait until its status turns to InstallSucceeded and grafana-operator-xxx-xxx pods is running :
$ oc get pods -n grafana -o name
pod/grafana-operator-55bfc5c588-dmqn4
Before creating Grafana Instance and Grafana Data Source , Administrators need to create special user to the existing Prometheus secret: 1. Navigate to openshift-monitoring namespace:
$ oc project openshift-monitoring
Now using project "openshift-monitoring" on server "https://api.cluster-xxxxxxxx:6443"
- Dump the prometheus-k8s-htpassword data:
oc get secret prometheus-k8s-htpasswd -o jsonpath='{.data.auth}' | base64 -d > /tmp/htpasswd-tmp
- Create special user to the existing Prometheus secret:
$ htpasswd -s -b  /tmp/htpasswd-tmp grafana-user mysupersecretpasswd
Adding password for user grafana-user
- Correct the htpasswd list:
$ cat /tmp/htpasswd-tmp | tail -1
grafana-user:{SHA}XXXXXXXXXXXXXXXXXXXXXXXX=
- Replace the prometheus-k8s-secret data with our /tmp/htpasswd-tmp:
$ oc patch secret prometheus-k8s-htpasswd -p "{\"data\":{\"auth\":\"$(base64 -w0 /tmp/htpasswd-tmp)\"}}"
secret/prometheus-k8s-htpasswd patched
- Delete the sts pods, to replace the pods with new data:
$ oc delete pods -l app=prometheus
pod "prometheus-k8s-0" deleted
pod "prometheus-k8s-1" deleted

$ oc get pods -l app=prometheus -o name
pod/prometheus-k8s-0
pod/prometheus-k8s-1
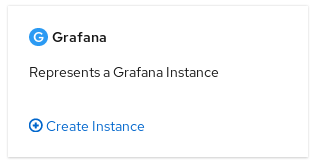
Create Grafana Instance: 1. Navigate to Installed Operators , and Click Grafana Operator (Make sure we are in grafana Project) 2. Click Create Instance on Grafana Card
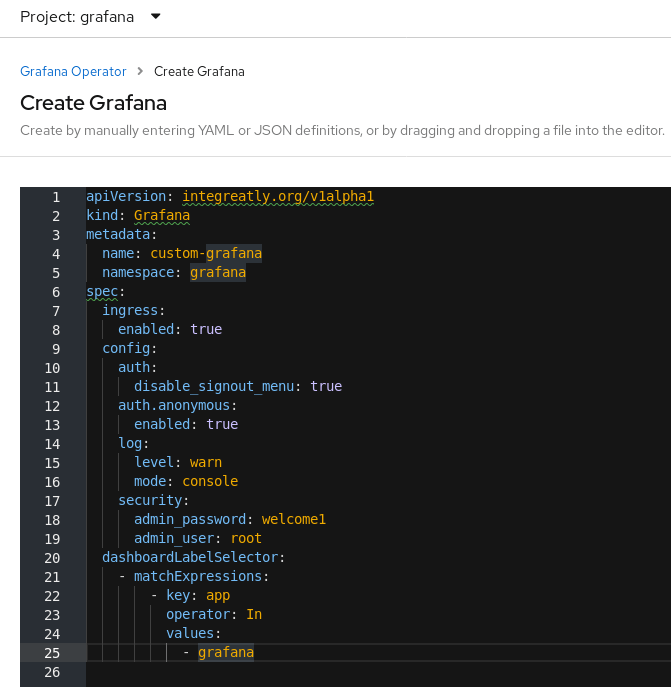
- In Create Grafana Page, Adjust the setting in YAML Editor. Here, I modified
metadata.nameandspec.config.security.admin_passwordvalues
- Ensure grafana-deployment-xxx-xxx pods is now running:
$ oc get pods -n grafana -o name
pod/grafana-deployment-776467548-zlslw
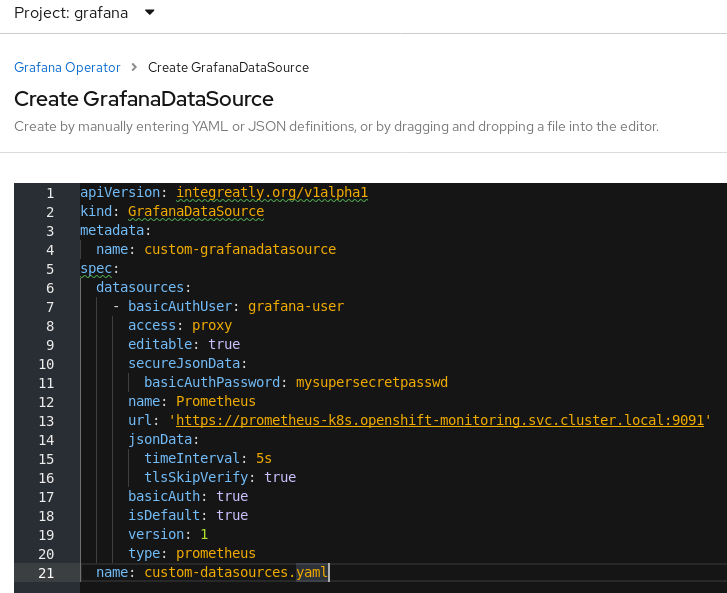
Create Grafana Data Source : – From Grafana Data Source Tab, Click Create GrafanaDataSource Button – I modified metadata.name, spec.name, .basicAuthUser and .basicAuthPassword – Click Create Button. Operator will automatically replace the grafana-deployment-xxx-xxx pods to reflect the new configuration
$ oc get pods -n grafana
NAME READY STATUS RESTARTS AGE
grafana-deployment-776467548-qsbpc 0/1 Init:0/1 0 1s
grafana-deployment-776467548-zlslw 1/1 Terminating 0 16s
grafana-operator-bb469fcc4-t5hxv 1/1 Running 0 8m59s

$ oc get pods
NAME                                 READY   STATUS    RESTARTS   AGE
grafana-deployment-776467548-qsbpc   1/1     Running   0          18s
grafana-operator-bb469fcc4-t5hxv     1/1     Running   0          9m16s
Retrieve the route location to access Grafana from outside the cluster with https, and Login as root with the password we defined while creating Grafana Instance :
$ oc get route
NAME            HOST/PORT                                                              PATH   SERVICES          PORT      TERMINATION   WILDCARD
grafana-route   grafana-route-grafana.apps.<cluster-name>.<domain-name>          grafana-service   grafana   edge          None
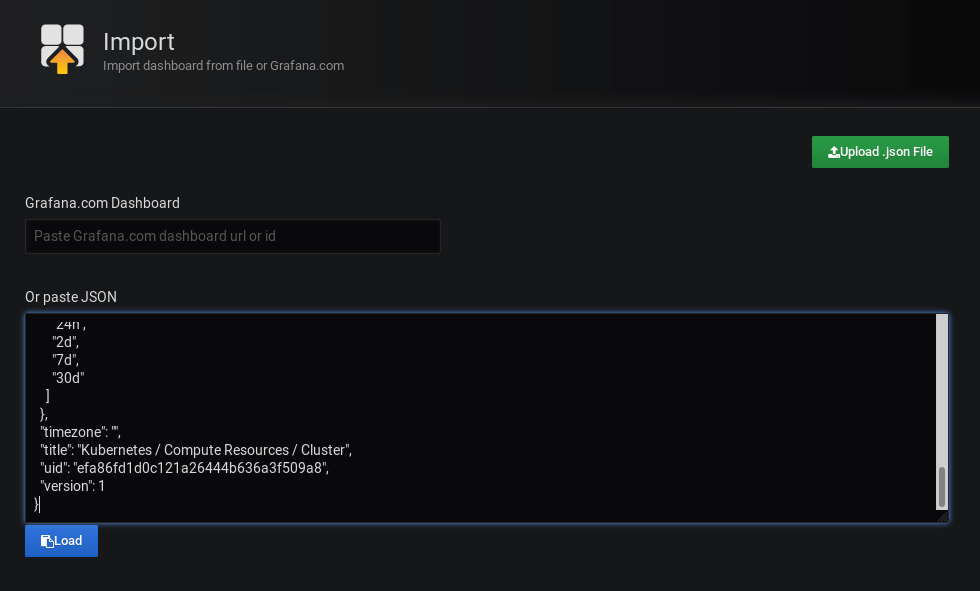
Now, Administrator can create the custom Dashboards. e.g: 1. Login to OpenShift Monitoring Stack Grafana 2. Select one of Dashboard, Kubernetes / Compute Resources / Cluster 3. Click Share Dashboard Icon 4. Click View JSON button from Export Tab, and Click Copy to Clipboard button 5. From Custom Grafana Instance, Click Dashboards Icon, and Click Manage 6. Click Import button, Paste , and click Load Button
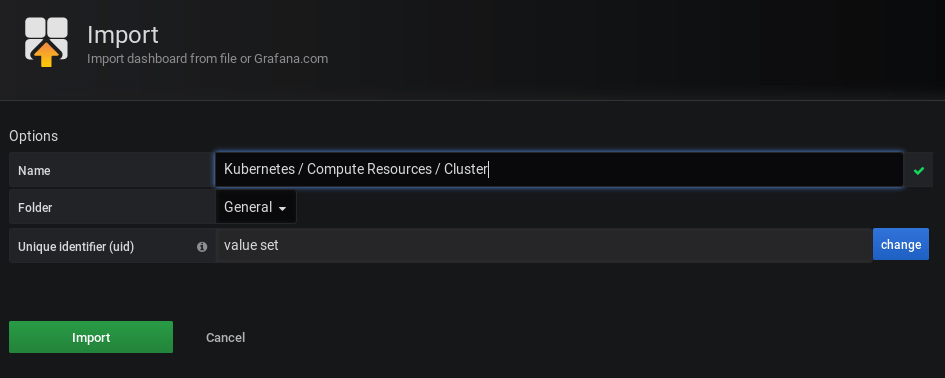
- Modify whenever required, and Click Import
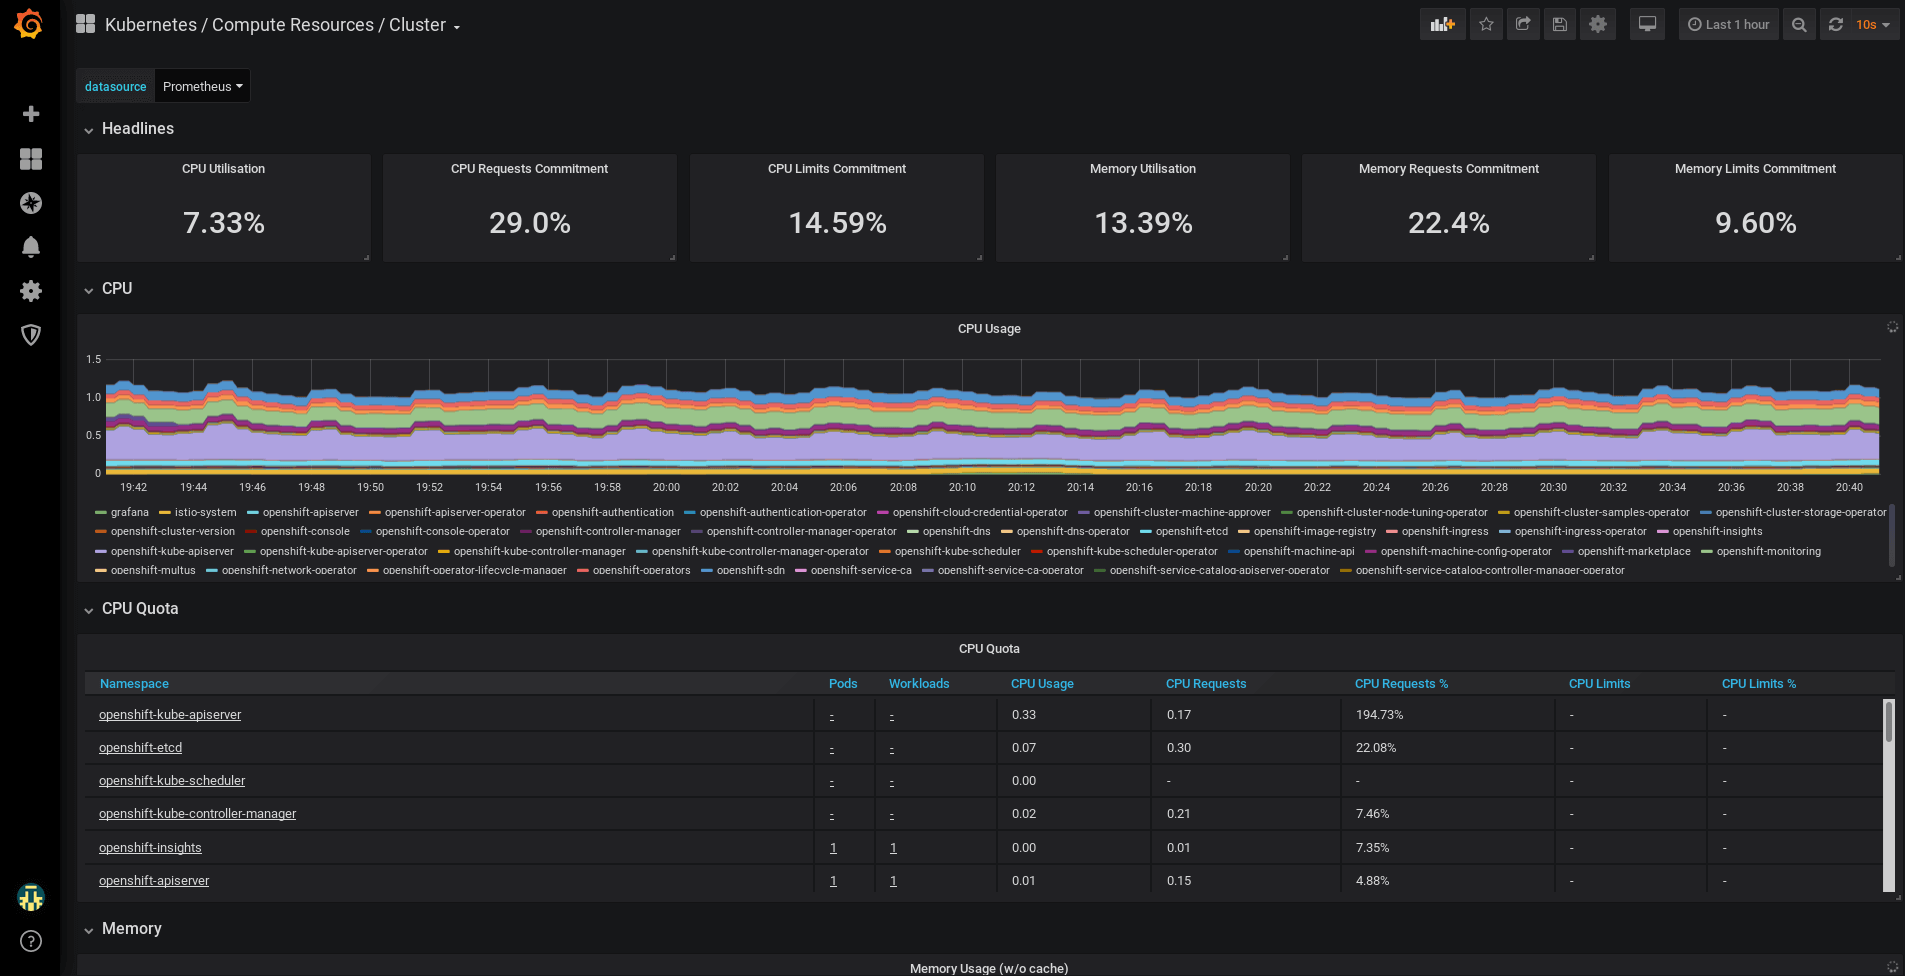
- Review Dashboard
Abip Sjarbini
Platform Consultant at Red Hat, Oracle Engineered Systems Specialist
Note
Disclaimer: The views expressed and the content shared in all published articles on this website are solely those of the respective authors, and they do not necessarily reflect the views of the author’s employer or the techbeatly platform. We strive to ensure the accuracy and validity of the content published on our website. However, we cannot guarantee the absolute correctness or completeness of the information provided. It is the responsibility of the readers and users of this website to verify the accuracy and appropriateness of any information or opinions expressed within the articles. If you come across any content that you believe to be incorrect or invalid, please contact us immediately so that we can address the issue promptly.