
A DevOps Guide to Kubernetes Logging
Learn tips and tricks to set up and use Kubernetes Logging to collect logs from all your applications and services deployed on the Kubernetes platform.
Introduction
Kubernetes Logging can be a challenging but essential part of running a Kubernetes cluster. As a developer, it’s crucial to understand the basics of Logging with Kubernetes so you can troubleshoot issues and optimize your applications.
Here’s an introduction to logging with Kubernetes, including everything from log aggregation setup to data analysis. We’ll also discuss some popular logging frameworks for Kubernetes and how to get started. Read on if you’re eager to learn how to log data with Kubernetes.
A Basic Introduction to Kubernetes logging
Kubernetes is a platform for deploying and managing containerized applications. One of its key features is its logging system, often known as a log monitoring and management system, which allows you to collect and analyze the logs from your applications.
Kubernetes logging is a feature that logs every aspect of your Kubernetes environment. It can help you troubleshoot service problems, understand application performance, and optimize your applications.
Kubernetes allows you to track the following:
- Service logs — Logs generated by each container or pod
- Application logs — Logs generated by each application or its dependencies
- Log groups — Logs grouped by type (service logs, application logs)
The most common use case for logs is identifying what resources are consuming CPU or RAM; this is done by attaching a log stream from one or more local or remote services to a LoggingStream object.
The LoggingStream can then be used by other services in the cluster (for example, a service health check).
Important Logging Features in Kubernetes
There are several essential logging features in Kubernetes that you should be aware of:
- Logs are stored in a central location: All of the logs from your applications are stored in a central location, making them easy to access and analyze.
- Logs are organized by namespace: Kubernetes automatically organizes logs by namespace, making it easy to find the logs for a particular application or component.
- Logs are searchable: Kubernetes provides a powerful search interface that makes it easy to find the logs you’re looking for.
Lastly, Kubernetes automatically rotates logs, so you don’t have to worry about them taking up too much space on your disk.
How to Collect Kubernetes Logs
There are two main ways to collect Kubernetes logs:
- Use the
kubectl logscommand: This command allows you to collect the logs for a specific pod or container. - Use a logging agent: You can also use a logging agent, such as Fluentd or Logstash, to collect Kubernetes logs.
The Unique Benefits of Logging with Kubernetes
Kubernetes has several unique benefits that make it an ideal logging solution:
- It’s highly scalable and can handle large amounts of data
- The logging tool makes it easy to collect and view logs from multiple sources in a single place
- It’s designed for distributed systems
- Kubernetes provides built-in tools for log rotation and retention
- Its simple design makes it easy to monitor and receive alerts on log data
Kubernetes is also a good choice for organizations that are using or considering using containers and microservices. That’s because it’s designed to work well with these technologies.
Kubernetes logging is best for:
- Organizations looking to centralize logging but want to avoid managing their logging infrastructure.
- DevOps teams that already use Kubernetes and want to take advantage of its logging features.
Why Managing & Retrieving Kubernetes Logs is Challenging
Managing and retrieving Kubernetes logs can be a daunting task.
Kubernetes creates a lot of log files, and the files can be spread across multiple servers. Retrieving logs from multiple servers can be complicated and time-consuming.
In addition, the logfiles’ structure can vary from server to server, making it challenging to find the information you need. The log files also tend to be verbose, making it difficult to determine what’s important and what’s not.
Though managing/retrieving Kubernetes logs can be tricky, it’s a priority task if you want a healthy cluster.
Kubernetes Logging Architecture
To summarize, Kubernetes uses a three-tier architecture for logging:
- The logging agent writes logs to the disk and forwards them to the logging backend.
- The logging backend stores logs in a database or other storage backend.
- Log Visualization, where developers can search, filter, and analyze logs.
The simple build makes it intuitive, easy to use, and versatile for all logging tasks.
How to Collect Logs
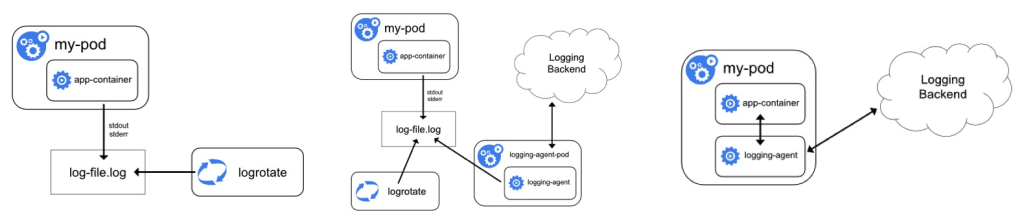
There are two ways to collect logs in Kubernetes:
- Node-level logging
- Cluster-level logging
Node-level logging
Node-level logging means each node in the Kubernetes cluster writes its logs to a local file. This is the simplest way to collect logs, but it has some drawbacks.
First, it’s not easy to access logs stored on individual nodes. Second, if a node goes down, its logs will be lost.
Cluster-level logging
Cluster-level logging means all of the nodes in the Kubernetes cluster send their logs to a central location. This is more complex than node-level logging, but it has some advantages.
First, it’s easy to access logs from a single location. Second, if a node goes down, its logs will be stored safely in the central location.
The method you choose depends on your needs. If you want simplicity, go with node-level logging. If you want reliability, go with cluster-level logging.
Example of Kubernetes Logging using Node-level Approach
If you’re still struggling to understand logging with Kubernetes using the node-level approach, check out this code snippet from the Kubernetes documentation:
To set up a node-level logging agent to send logs to a centralized logging backend, you can use any Fluentd docker image.
Kubernetes documentation
For example, the following command starts a node-level logging agent that sends all logs to a remote Syslog server:
$ docker run --log-driver=fluentd --log-opt=fluentd-address=localhost:24224 \--log-opt tag="kubelet.*" quay.io/fluentd_elasticsearch/fluentd:v2.3.3In this snippet, the coder uses a docker run command to start a node-level logging agent that transfers all logs to a remote Syslog server.
The --log-driver and --log-opt options are used to specify the Fluentd logging driver and options, respectively. The quay.io/fluentd_elasticsearch/fluentd:v2.3.3 Docker image is used to provide the Fluentd logging agent.
Popular Logging Frameworks to Use With Kubernetes
Kubernetes logging is a critical part of any DevOps workflow, and there are many ways to set it up. Here are a few options if you choose to use a logging agent:
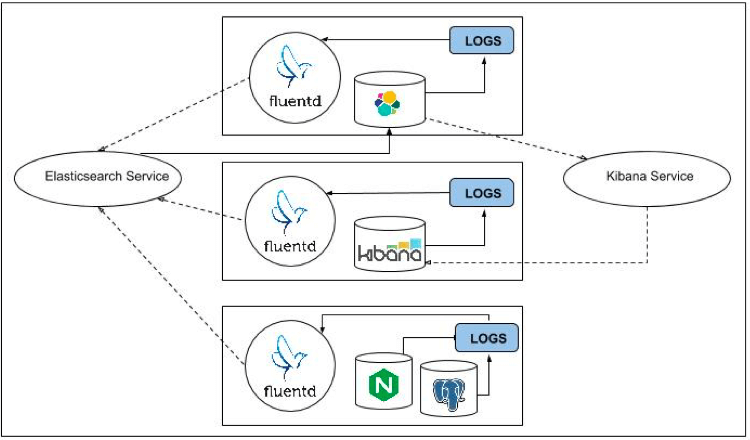
- Fluentd is an open-source logging tool that you can use to collect, parse, and store Kubernetes logs. It has a pluggable architecture that allows it to integrate with various storage backends, such as Elasticsearch, MongoDB, and S3.
- ELK is a popular open-source logging stack that includes the Elasticsearch, Logstash, and Kibana components. It collects, parses, and stores Kubernetes logs and provides a web interface for searching and visualizing log data.
Both Fluentd and ELK are great options for logging on Kubernetes, and there are many other Kubernetes monitoring and logging tools, like Middleware, Datadog, etc. are also available that use a custom agent to pull all the metrics from the clusters and reflect them in their dashboards.
The best choice for your team will depend on your specific needs and preferences.
No matter which tool you choose, setting up Kubernetes logging is critical to any DevOps workflow. By collecting and analyzing Kubernetes logs, you can gain insight into the performance of your applications and the health of your Kubernetes cluster.
7 Best Practices for Using Kubernetes Logging
Kubernetes logs are critical to any Kubernetes deployment as they provide valuable insights into an application’s health and performance. There are many ways to configure logging in Kubernetes, and the best approach varies by need.
Here are seven best practices for logging on the Kubernetes platform.
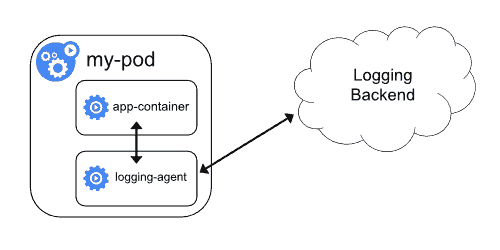
- Collect logs at the pod level.
- Use a dedicated logging agent.
- Configure log rotation.
- Ship logs to a central log management system.
- Aggregate and parse logs.
- Monitor logs for anomalies.
- Retain logs for historical analysis.
These best practices will ensure you get the most out of your Kubernetes logging setup.
Collecting logs at the pod level and shipping them to a central management system gives valuable insights into your app’s health/performance.
Additionally, configuring log rotation and monitoring for anomalies will ensure that your logs are always accurate and up-to-date.
Wrapping Up
Logging with Kubernetes offers multiple benefits for DevOps teams. For one, it helps to aggregate and organize logs from various containers and sources in one place. This can be a big help for teams when troubleshooting issues or tracking down specific events.
In addition, it can provide visibility into the underlying infrastructure, making it easier to identify potential issues and act accordingly. Finally, Kubernetes can provide valuable insights into application performance helping DevOps teams make data-driven decisions.
That said, we leave you with these three key takeaways:
- Always collect logs at the source to get a complete and accurate record of what happened.
- Centralize your logging data for easy log search and analysis.
- Finally, develop a plan for dealing with log data when it gets too big or too old. You don’t want your logging data to become a liability.
Disclaimer:
The views expressed and the content shared in all published articles on this website are solely those of the respective authors, and they do not necessarily reflect the views of the author’s employer or the techbeatly platform. We strive to ensure the accuracy and validity of the content published on our website. However, we cannot guarantee the absolute correctness or completeness of the information provided. It is the responsibility of the readers and users of this website to verify the accuracy and appropriateness of any information or opinions expressed within the articles. If you come across any content that you believe to be incorrect or invalid, please contact us immediately so that we can address the issue promptly.
Tags:
Latest posts


Comments
Leave a Reply