
Creating the Elastic Stack on AWS using Terraform
Elastic stack brings all the logs & traces into a single place & Terraform is an Infrastructure as code provisioner. While exploring both of them, I took on the challenge of deploying one using the other!
This article was originally posted via LinkedIn @ https://www.linkedin.com/in/shishirkhandelwal/
Elastic Stack is a popular tool for storing and viewing logs of VMs and pods. Though AWS offers its own ElasticSearch as a managed service, there are many advantages of deploying the stack on ECs instead such as comparatively low costs and greater control on all the settings.
The Elastic Stack comprises of –
Elasticsearch where data is stored.
Filebeat which ships the logs into ElasticSearch thorugh logstash
Logstash which can filter the logs before letting them pass to the next step.
Kibana which helps in visualizing the data and navigate the logs.
This article is a walkthrough on deploying the ElasticStack on AWS using Terraform. The elastic stack would be deployed in a newly created VPC, after which Filebeat would be set up on an EC2 so that some logs can be viewed. Logstash can be used to apply filters on the data before it is passed onto the elastic search.
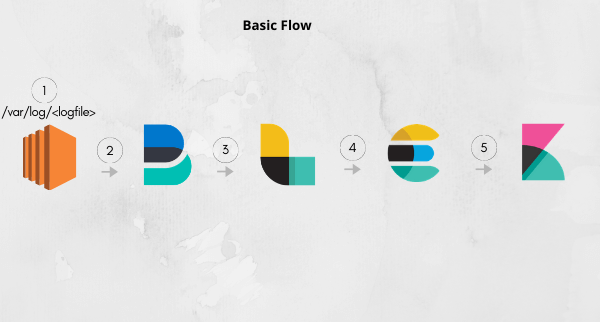
Logs are created and stored inside /var/log
Filebeat takes up these logs and sends them to logstash at port 5044.
Logstash can then apply filters to these logs. It also works without a filter. It then sends all the logs to the elasticsearch cluster at 9200.
Kibana is configured to display logs from elasticsearch port 9200.
Finally, the user can access these logs from the kibana dashboard.
Configuration setup (Very important!): Each of the components requires a configuration file. To set it up, we need to install the components on our EC2 and then make the necessary changes to the file. Since making changes through multiple “sed” commands will be troublesome, a better approach is to first acquire these files, do updates using the terraform “data_template” option and then replace the default file with the updated file. This must be done before starting the component.
To check all the files – https://github.com/shishirkhandelwal29/elasticstack-terraform-aws
Setup VPC, subnets, and internet access to the VPC: A new VPC is created and subnets in different AZs are created. This is done to ensure the high availability of the ElasticSearch cluster.
resource "aws_vpc" "elastic_vpc"{
  cidr_block = cidrsubnet("172.20.0.0/16",0,0)
  tags={
    Name="elastic_vpc"
  }
}

resource "aws_internet_gateway" "elastic_internet_gateway" {
  vpc_id = aws_vpc.elastic_vpc.id
  tags = {
    Name = "elastic_igw"
  }
}

resource "aws_route_table" "elastic_rt" {
  vpc_id = aws_vpc.elastic_vpc.id
  route {
    cidr_block = "0.0.0.0/0"
    gateway_id = aws_internet_gateway.elastic_internet_gateway.id
  }
  tags = {
    Name = "elastic_rt"
  }
}

resource "aws_main_route_table_association" "elastic_rt_main" {
  vpc_id         = aws_vpc.elastic_vpc.id
  route_table_id = aws_route_table.elastic_rt.id
}

resource "aws_subnet" "elastic_subnet"{
  for_each = {us-east-1a=cidrsubnet("172.20.0.0/16",8,10),us-east-1b=cidrsubnet("172.20.0.0/16",8,20),us-east-1c=cidrsubnet("172.20.0.0/16",8,30)}
  vpc_id = aws_vpc.elastic_vpc.id
  availability_zone = each.key
  cidr_block = each.value
  tags={
    Name="elastic_subnet_${each.key}"
  }
}

variable "az_name" {
  type    = list(string)
  default = ["us-east-1a","us-east-1b","us-east-1c"]

}
Setup ElasticSearch cluster: A three-node Elasticsearch cluster is set up with each node created in a different AZ. The security group has allowed inbound access to port 9200 as this is the port on which ElasticSeach is accessed. It will be required so that Kibana can access it.
resource "aws_security_group" "elasticsearch_sg" {
  vpc_id = aws_vpc.elastic_vpc.id
  ingress {
    description = "ingress rules"
    cidr_blocks = [ "0.0.0.0/0" ]
    from_port = 22
    protocol = "tcp"
    to_port = 22
  }
  ingress {
    description = "ingress rules"
    cidr_blocks = [ "0.0.0.0/0" ]
    from_port = 9200
    protocol = "tcp"
    to_port = 9300
  }
  egress {
    description = "egress rules"
    cidr_blocks = [ "0.0.0.0/0" ]
    from_port = 0
    protocol = "-1"
    to_port = 0
  }
  tags={
    Name="elasticsearch_sg"
  }
}

resource "aws_key_pair" "elastic_ssh_key" {
  key_name="tf-kp"
  public_key= file("tf-kp.pub")
}

resource "aws_instance" "elastic_nodes" {
  count = 3
  ami                    = "ami-04d29b6f966df1537"
  instance_type          = "t2.large"
  subnet_id = aws_subnet.elastic_subnet[var.az_name[count.index]].id
  vpc_security_group_ids = [aws_security_group.elasticsearch_sg.id]
  key_name               = aws_key_pair.elastic_ssh_key.key_name
  associate_public_ip_address = true
  tags = {
    Name = "elasticsearch_${count.index}"
  }
}

data "template_file" "init_elasticsearch" {
  depends_on = [
    aws_instance.elastic_nodes
  ]
  count=3
  template = file("./elasticsearch_config.tpl")
  vars = {
    cluster_name = "cluster1"
    node_name = "node_${count.index}"
    node = aws_instance.elastic_nodes[count.index].private_ip
    node1 = aws_instance.elastic_nodes[0].private_ip
    node2 = aws_instance.elastic_nodes[1].private_ip
    node3 = aws_instance.elastic_nodes[2].private_ip
  }
}

resource "null_resource" "move_elasticsearch_file" {
  count = 3
  connection {
     type = "ssh"
     user = "ec2-user"
     private_key = file("tf-kp.pem")
     host= aws_instance.elastic_nodes[count.index].public_ip
  }
  provisioner "file" {
    content = data.template_file.init_elasticsearch[count.index].rendered
    destination = "elasticsearch.yml"
  }
}

resource "null_resource" "start_es" {
  depends_on = [
    null_resource.move_elasticsearch_file
  ]
  count = 3
  connection {
     type = "ssh"
     user = "ec2-user"
     private_key = file("tf-kp.pem")
     host= aws_instance.elastic_nodes[count.index].public_ip
  }
  provisioner "remote-exec" {
    inline = [
      "#!/bin/bash",
      "sudo yum update -y",
      "sudo rpm -i https://artifacts.elastic.co/downloads/elasticsearch/elasticsearch-7.5.1-x86_64.rpm",
      "sudo systemctl daemon-reload",
      "sudo systemctl enable elasticsearch.service",
      "sudo sed -i 's@-Xms1g@-Xms${aws_instance.elastic_nodes[count.index].root_block_device[0].volume_size/2}g@g' /etc/elasticsearch/jvm.options",
      "sudo sed -i 's@-Xmx1g@-Xmx${aws_instance.elastic_nodes[count.index].root_block_device[0].volume_size/2}g@g' /etc/elasticsearch/jvm.options",
      "sudo rm /etc/elasticsearch/elasticsearch.yml",
      "sudo cp elasticsearch.yml /etc/elasticsearch/",
      "sudo systemctl start elasticsearch.service"
    ]
  }
}
Setup Kibana: Kibana is our UI to navigate through the logs. It runs on port 5601.
resource "aws_security_group" "kibana_sg" {
  vpc_id = aws_vpc.elastic_vpc.id
  ingress {
    description = "ingress rules"
    cidr_blocks = [ "0.0.0.0/0" ]
    from_port = 22
    protocol = "tcp"
    to_port = 22
  }
  ingress {
    description = "ingress rules"
    cidr_blocks = [ "0.0.0.0/0" ]
    from_port = 5601
    protocol = "tcp"
    to_port = 5601
  }
  egress {
    description = "egress rules"
    cidr_blocks = [ "0.0.0.0/0" ]
    from_port = 0
    protocol = "-1"
    to_port = 0
  }
  tags={
    Name="kibana_sg"
  }
}


resource "aws_instance" "kibana" {
  depends_on = [
    null_resource.start_es
   ]
  ami                    = "ami-04d29b6f966df1537"
  instance_type          = "t2.large"
  subnet_id = aws_subnet.elastic_subnet[var.az_name[0]].id
  vpc_security_group_ids = [aws_security_group.kibana_sg.id]
  key_name               = aws_key_pair.elastic_ssh_key.key_name
  associate_public_ip_address = true
  tags = {
    Name = "kibana"
  }
}
data "template_file" "init_kibana" {
  depends_on = [
    aws_instance.kibana
  ]
  template = file("./kibana_config.tpl")
  vars = {
    elasticsearch = aws_instance.elastic_nodes[0].public_ip
  }
}
resource "null_resource" "move_kibana_file" {
  depends_on = [
    aws_instance.kibana
   ]
  connection {
     type = "ssh"
     user = "ec2-user"
     private_key = file("tf-kp.pem")
     host= aws_instance.kibana.public_ip
  }
  provisioner "file" {
    content = data.template_file.init_kibana.rendered
    destination = "kibana.yml"
  }
}


resource "null_resource" "install_kibana" {
  depends_on = [
      aws_instance.kibana
   ]
  connection {
    type = "ssh"
    user = "ec2-user"
    private_key = file("tf-kp.pem")
    host= aws_instance.kibana.public_ip
  }
  provisioner "remote-exec" {
    inline = [
      "sudo yum update -y",
      "sudo rpm -i https://artifacts.elastic.co/downloads/kibana/kibana-7.5.1-x86_64.rpm",
      "sudo rm /etc/kibana/kibana.yml",
      "sudo cp kibana.yml /etc/kibana/",
      "sudo systemctl start kibana"
    ]
  }
}
Setup Logstash: The purpose of logstash is simple – to take up logs sent by filebeats and apply filters to them before sending them to elasticsearch. For this purpose, it’s ingress must open a port 5044 – So that filebeats can make a connection with it. It must be created before filebeats, as filebeat’s configuration requires public IP of logstash.
resource "aws_security_group" "logstash_sg" {
  vpc_id = aws_vpc.elastic_vpc.id
  ingress {
    description = "ingress rules"
    cidr_blocks = [ "0.0.0.0/0" ]
    from_port = 22
    protocol = "tcp"
    to_port = 22
  }
  ingress {
    description = "ingress rules"
    cidr_blocks = [ "0.0.0.0/0" ]
    from_port = 5044
    protocol = "tcp"
    to_port = 5044
  }
  egress {
    description = "egress rules"
    cidr_blocks = [ "0.0.0.0/0" ]
    from_port = 0
    protocol = "-1"
    to_port = 0
  }
  tags={
    Name="logstash_sg"
  }
}


resource "aws_instance" "logstash" {
  depends_on = [
    null_resource.install_kibana
   ]
  ami                    = "ami-04d29b6f966df1537"
  instance_type          = "t2.large"
  subnet_id = aws_subnet.elastic_subnet[var.az_name[0]].id
  vpc_security_group_ids = [aws_security_group.logstash_sg.id]
  key_name               = aws_key_pair.elastic_ssh_key.key_name
  associate_public_ip_address = true
  tags = {
    Name = "logstash"
  }
}

data "template_file" "init_logstash" {
  depends_on = [
    aws_instance.logstash
  ]
  template = file("./logstash_config.tpl")
  vars = {
    elasticsearch = aws_instance.elastic_nodes[0].public_ip
  }
}

resource "null_resource" "move_logstash_file" {
  depends_on = [
    aws_instance.logstash
   ]
  connection {
     type = "ssh"
     user = "ec2-user"
     private_key = file("tf-kp.pem")
     host= aws_instance.logstash.public_ip
  }
  provisioner "file" {
    content = data.template_file.init_logstash.rendered
    destination = "logstash.conf"
  }
}


resource "null_resource" "install_logstash" {
  depends_on = [
      aws_instance.logstash
   ]
  connection {
    type = "ssh"
    user = "ec2-user"
    private_key = file("tf-kp.pem")
    host= aws_instance.logstash.public_ip
  }
  provisioner "remote-exec" {
    inline = [
      "sudo yum update -y && sudo yum install java-1.8.0-openjdk -y",
      "sudo rpm -i https://artifacts.elastic.co/downloads/logstash/logstash-7.5.1.rpm",
      "sudo cp logstash.conf /etc/logstash/conf.d/logstash.conf",
      "sudo systemctl start logstash.service"
    ]
  }
}
Setup Filebeat: Filebeats by default takes up logs from /var/log/ and sends them to logstash on port 5044. If there is a requirement to ship logs from an already existing EC2, filebeat must be installed and configured on it.
resource "aws_security_group" "filebeat_sg" {
  vpc_id = aws_vpc.elastic_vpc.id
  ingress {
    description = "ingress rules"
    cidr_blocks = [ "0.0.0.0/0" ]
    from_port = 22
    protocol = "tcp"
    to_port = 22
  }
  egress {
    description = "egress rules"
    cidr_blocks = [ "0.0.0.0/0" ]
    from_port = 0
    protocol = "-1"
    to_port = 0
  }
  tags={
    Name="filebeat_sg"
  }
}


resource "aws_instance" "filebeat" {
  depends_on = [
    null_resource.install_logstash
   ]
  ami                    = "ami-04d29b6f966df1537"
  instance_type          = "t2.large"
  subnet_id = aws_subnet.elastic_subnet[var.az_name[0]].id
  vpc_security_group_ids = [aws_security_group.filebeat_sg.id]
  key_name               = aws_key_pair.elastic_ssh_key.key_name
  associate_public_ip_address = true
  tags = {
    Name = "filebeat"
  }
}


resource "null_resource" "move_filebeat_file" {
  depends_on = [
    aws_instance.filebeat
   ]
  connection {
     type = "ssh"
     user = "ec2-user"
     private_key = file("tf-kp.pem")
     host= aws_instance.filebeat.public_ip
  }
  provisioner "file" {
    source = "filebeat.yml"
    destination = "filebeat.yml"
  }
}


resource "null_resource" "install_filebeat" {
  depends_on = [
    null_resource.move_filebeat_file
   ]
  connection {
    type = "ssh"
    user = "ec2-user"
    private_key = file("tf-kp.pem")
    host= aws_instance.filebeat.public_ip
  }
  provisioner "remote-exec" {
    inline = [
      "sudo yum update -y",
      "sudo rpm -i https://artifacts.elastic.co/downloads/beats/filebeat/filebeat-7.5.1-x86_64.rpm",
      "sudo sed -i 's@kibana_ip@${aws_instance.kibana.public_ip}@g' filebeat.yml",
      "sudo sed -i 's@logstash_ip@${aws_instance.logstash.public_ip}@g' filebeat.yml",
      "sudo rm /etc/filebeat/filebeat.yml",
      "sudo cp filebeat.yml /etc/filebeat/",
      "sudo systemctl start filebeat.service"
    ]
  }
}
Final steps:
To see elasticsearch cluster status – visit <public IP of any es node>:9200/_cluster/health
To see elasticsearch nodes – visit <public IP of any es node>:9200/_cat/nodes?v
To see kibana in action – visit <public IP of kibana ec2>:5601
Inside Kibana – go to Settings-> Index Patterns -> Add the logstash index.
In case you are not able to get the index. Check logs of each component by SSHing into each of them. Use command – “sudo systemctl status <component-name> -l”
Verification: SSH into filebeat ec2. And add a sample log over by adding a .log file at /var/log/ or just use the following command –
echo "echo 'sample log 1 sample log 2 sample log 2' >> /var/log/sample-log.log" | sudo bash
After adding, search for this log inside Kibana. You will be able to see a record for it!
That’s it. The setup is complete now.
Disclaimer:
The views expressed and the content shared in all published articles on this website are solely those of the respective authors, and they do not necessarily reflect the views of the author’s employer or the techbeatly platform. We strive to ensure the accuracy and validity of the content published on our website. However, we cannot guarantee the absolute correctness or completeness of the information provided. It is the responsibility of the readers and users of this website to verify the accuracy and appropriateness of any information or opinions expressed within the articles. If you come across any content that you believe to be incorrect or invalid, please contact us immediately so that we can address the issue promptly.
Tags:
Latest posts


Comments
Leave a Reply