Integrating Ansible Automation Controller with Splunk
-
 Gineesh Madapparambath
- Ansible, Automation, Featured
- March 14, 2024
Do you use Red Hat Ansible Automation Controller to manage your IT infrastructure? Keeping track of what’s happening behind the scenes is crucial. This blog post will show you how to integrate Ansible Automation Controller with Splunk , a popular tool for collecting and analyzing logs.
Red Hat Ansible Automation Controller
Ansible Automation Controller is a powerful tool that helps you automate IT tasks across your infrastructure. It lets you run “playbooks” which are essentially scripts that automate tasks like provisioning servers, configuring software, and deploying applications.
Why External Logging Matters
While Ansible Automation Controller has its logging features, sometimes you might want to collect and analyze those logs in a separate tool like Splunk. This allows for:
- Better Insights: Splunk excels at analyzing large amounts of data. By sending Ansible Automation Controller logs to Splunk, you can gain deeper insights into how your automation is running, identify trends, and troubleshoot issues more efficiently.
- Centralized Monitoring: Splunk can collect logs from various sources, allowing you to see all your IT activity in one place. This helps you monitor your overall infrastructure health and identify potential problems quickly.
Integrating Ansible with Splunk
This guide will walk you through integrating Ansible Automation Controller with Splunk to collect logs externally:
Setting Up Splunk and HTTP Event Collector
We’ll be using Splunk’s HTTP Event Collector (HEC) to receive logs from Ansible.
Step 1. Follow the instructions to set up a Splunk server (we’ll use Podman in this example).
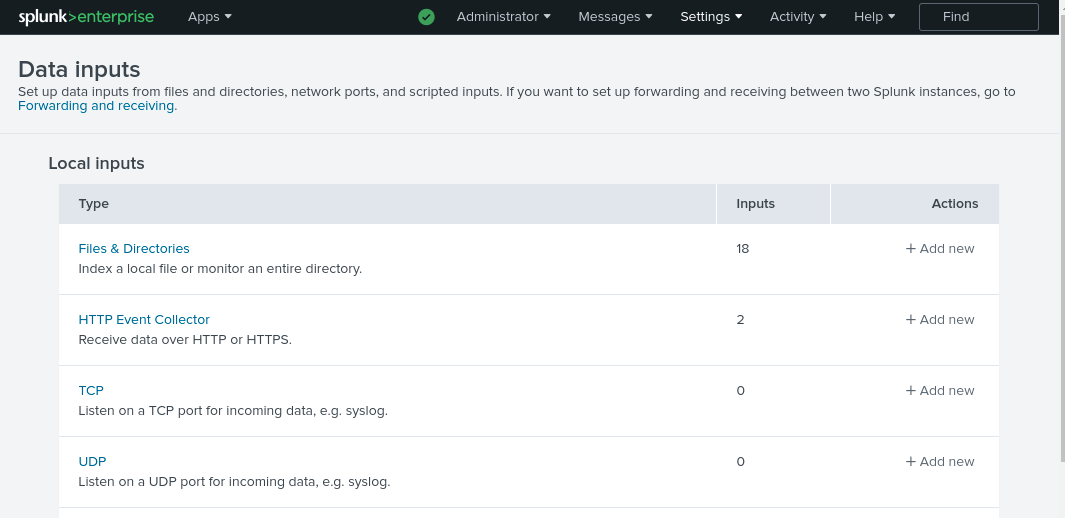
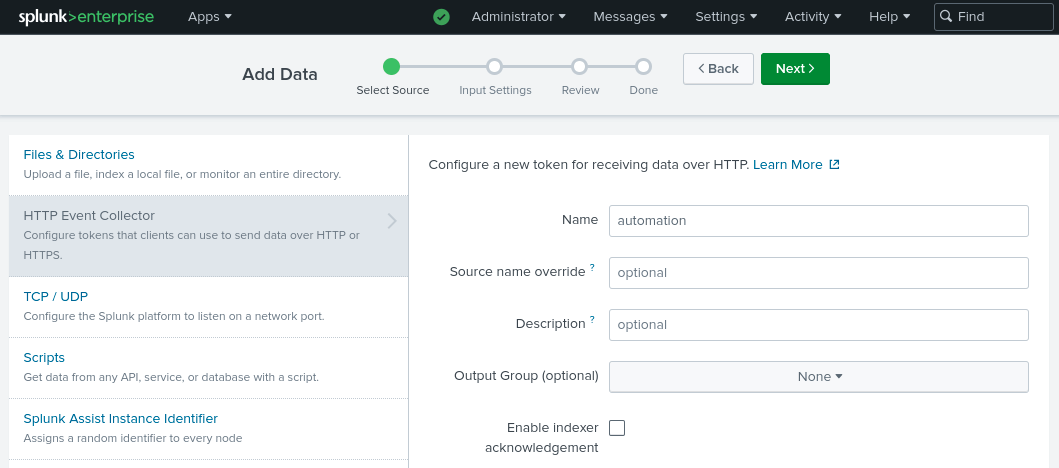
Step 2. Once Splunk is running, access the web interface and configure HEC. Create a new HEC and collect the token for later use.
From Splunk WEBUI -> Settings > Data Inputs -> HTTP Event Collector -> Add new
Use a name to identify your log collection (eg: automation ) and leave other fields with default values.
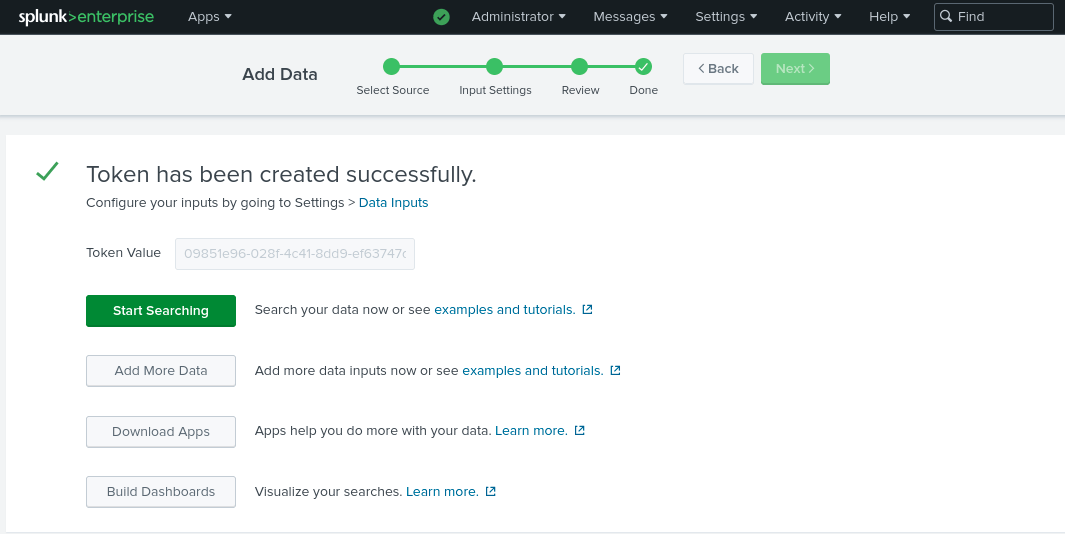
Remember to collect the token from the last screen as follows.
Step 3. Testing the Connection
Use the provided sample curl command to test sending a simple event to Splunk using the HEC token.
Set up environment variables (you can also pass the URL and Token directly)
$ export SPLUNK_TOKEN=
8c6d7e94-f01e-452f-b6cb-aa979e3cc4a7

$ export SPLUNK_URL=
https://192.168.57.1:8088
Test connection using a curl command as follows.
curl -kv "
$SPLUNK_URL
/services/collector/event" \
    -H "Authorization: Splunk
$SPLUNK_TOKEN
" \
    -H "Content-Type: application/json" \
    -d '{"event": "I am using IP!", "sourcetype": "manual"}'

...<removed for brevity>....

* Connection #0 to host 192.168.57.1 left intact

{"text":"Success","code":0}
Remember to replace the IP Address (Splunk server) and token in your command.
Check your Splunk search results to verify the event was received successfully.
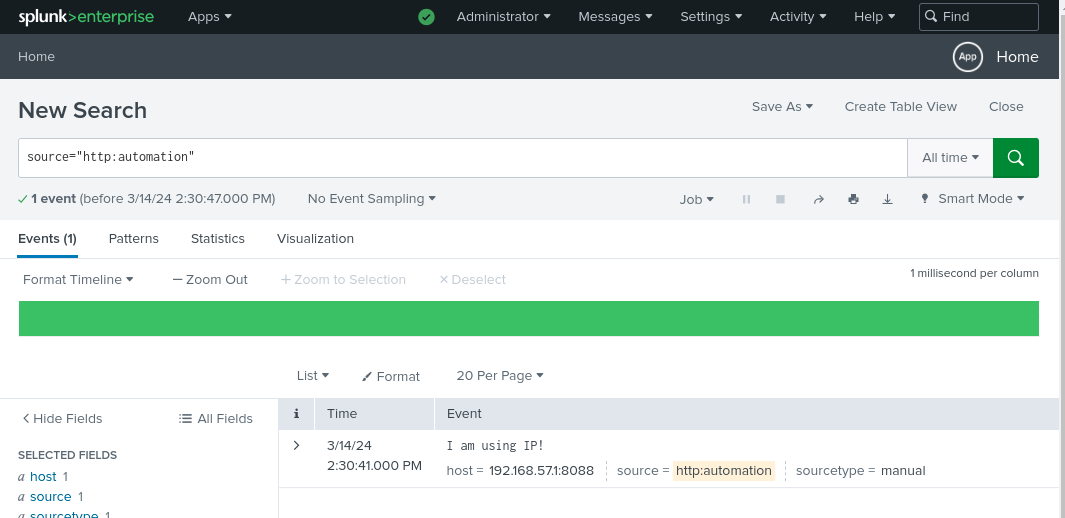
Important points to note on Splunk
-
The WEBUI port is
8000in my case. -
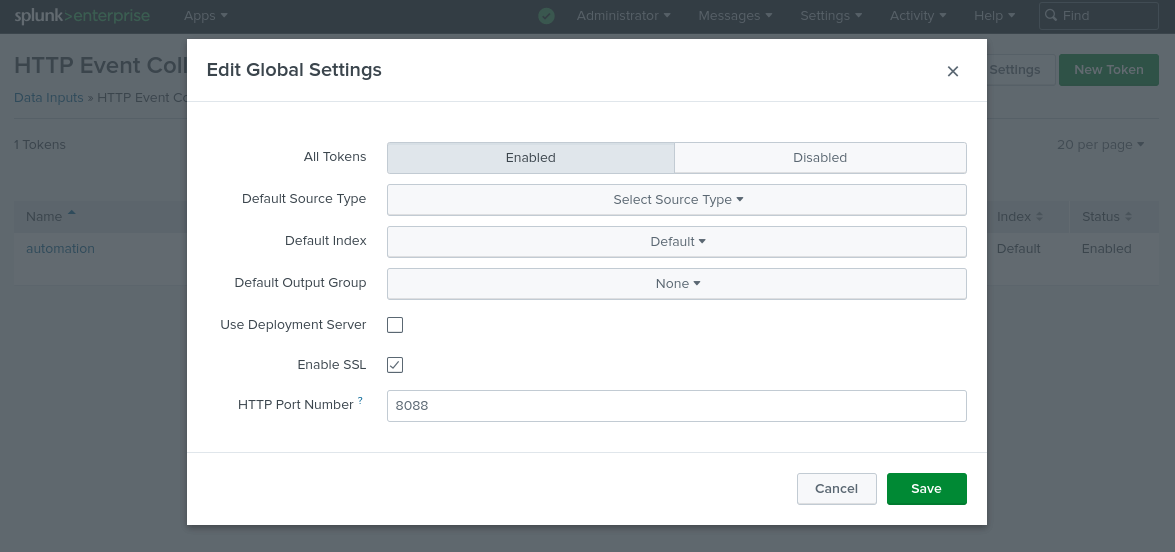
You should use the correct port number configured under HTTP Event Collector -> Edit Global Settings (default
8088) for sending events to Splunk. If you noticed the previouscurlcommand, we have usedhttps://192.168.57.1:8088.
Configuring Ansible Automation Controller Logging
Open the Ansible Automation Controller web interface and navigate to Settings -> Logging .
Edit the logging settings and enter the following details:
- Logging Aggregator:
https://192.168.57.1:8088/services/collector/event(The full URL to your Splunk HEC endpoint – replace the IP address with yours). - Logging Aggregator Type:
Splunk - Logging Aggregator Password/Token:
- Enable/disable HTTPS certificate verification:
OFF(Disable if using self-signed SSL for Splunk).
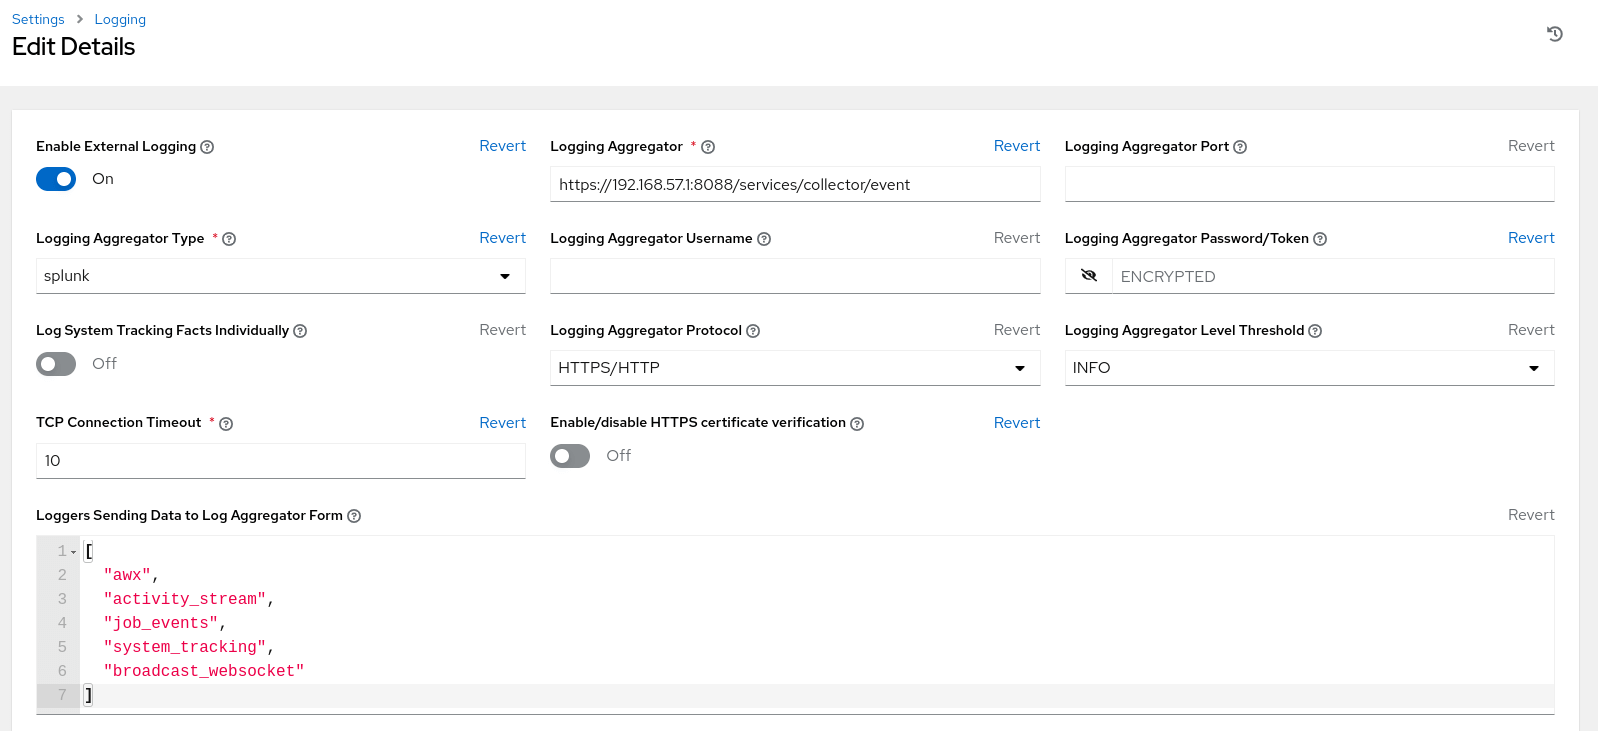
Save the configuration.
Verifying the Integration
Run a sample job within your Ansible Automation Controller.
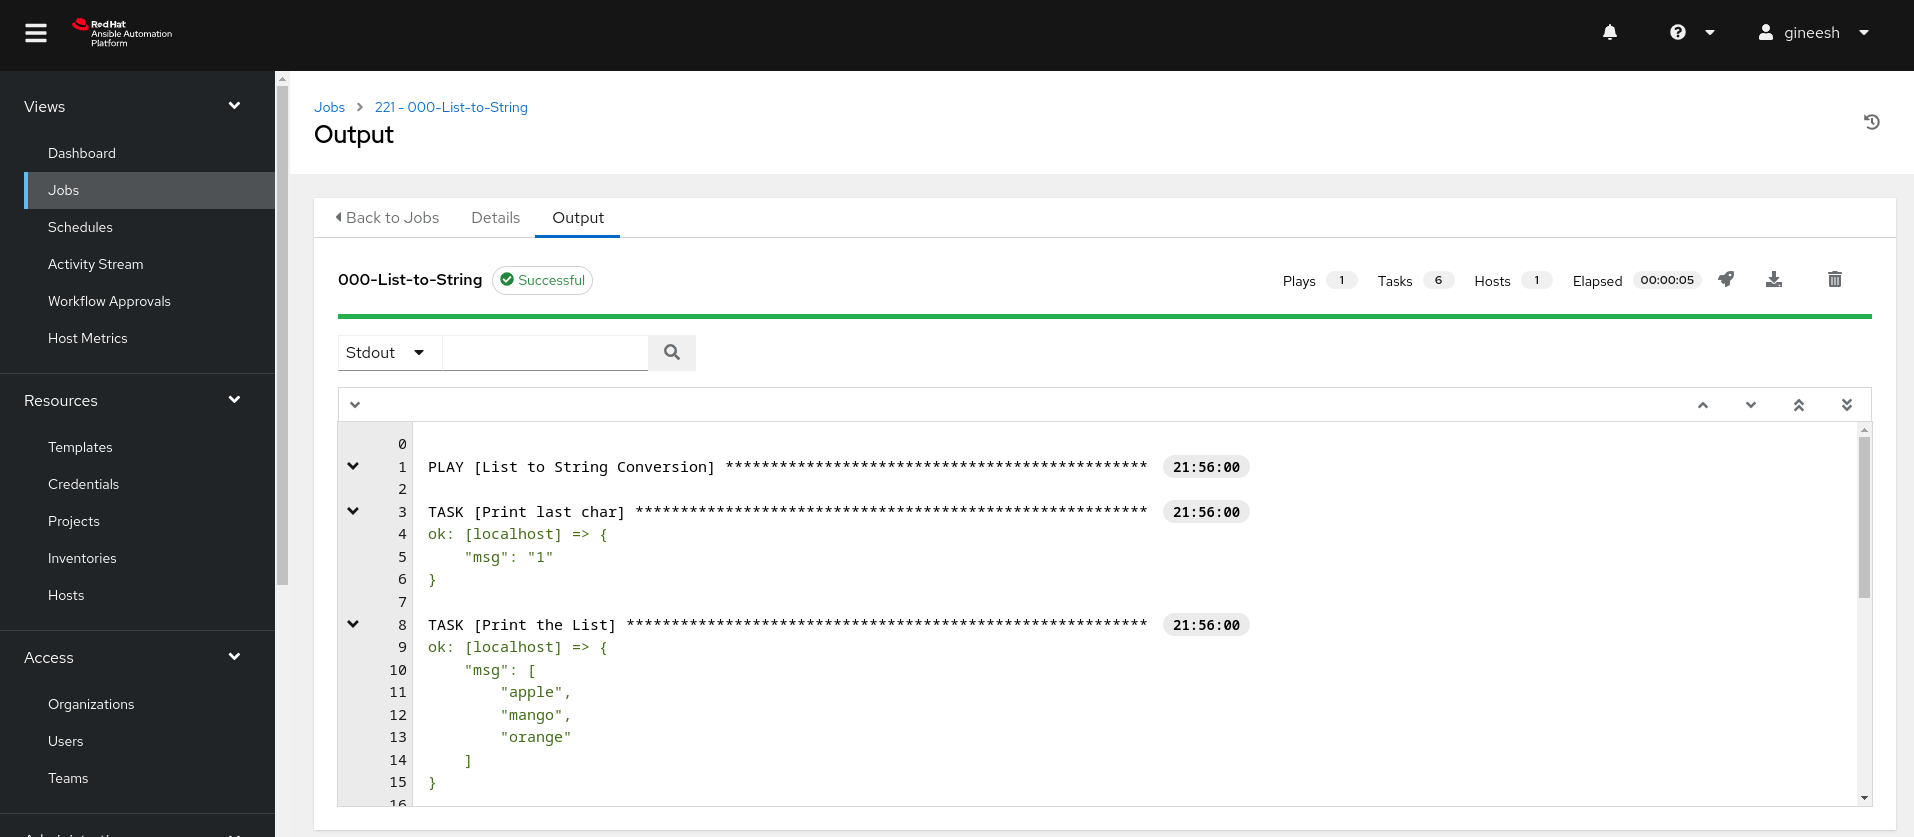
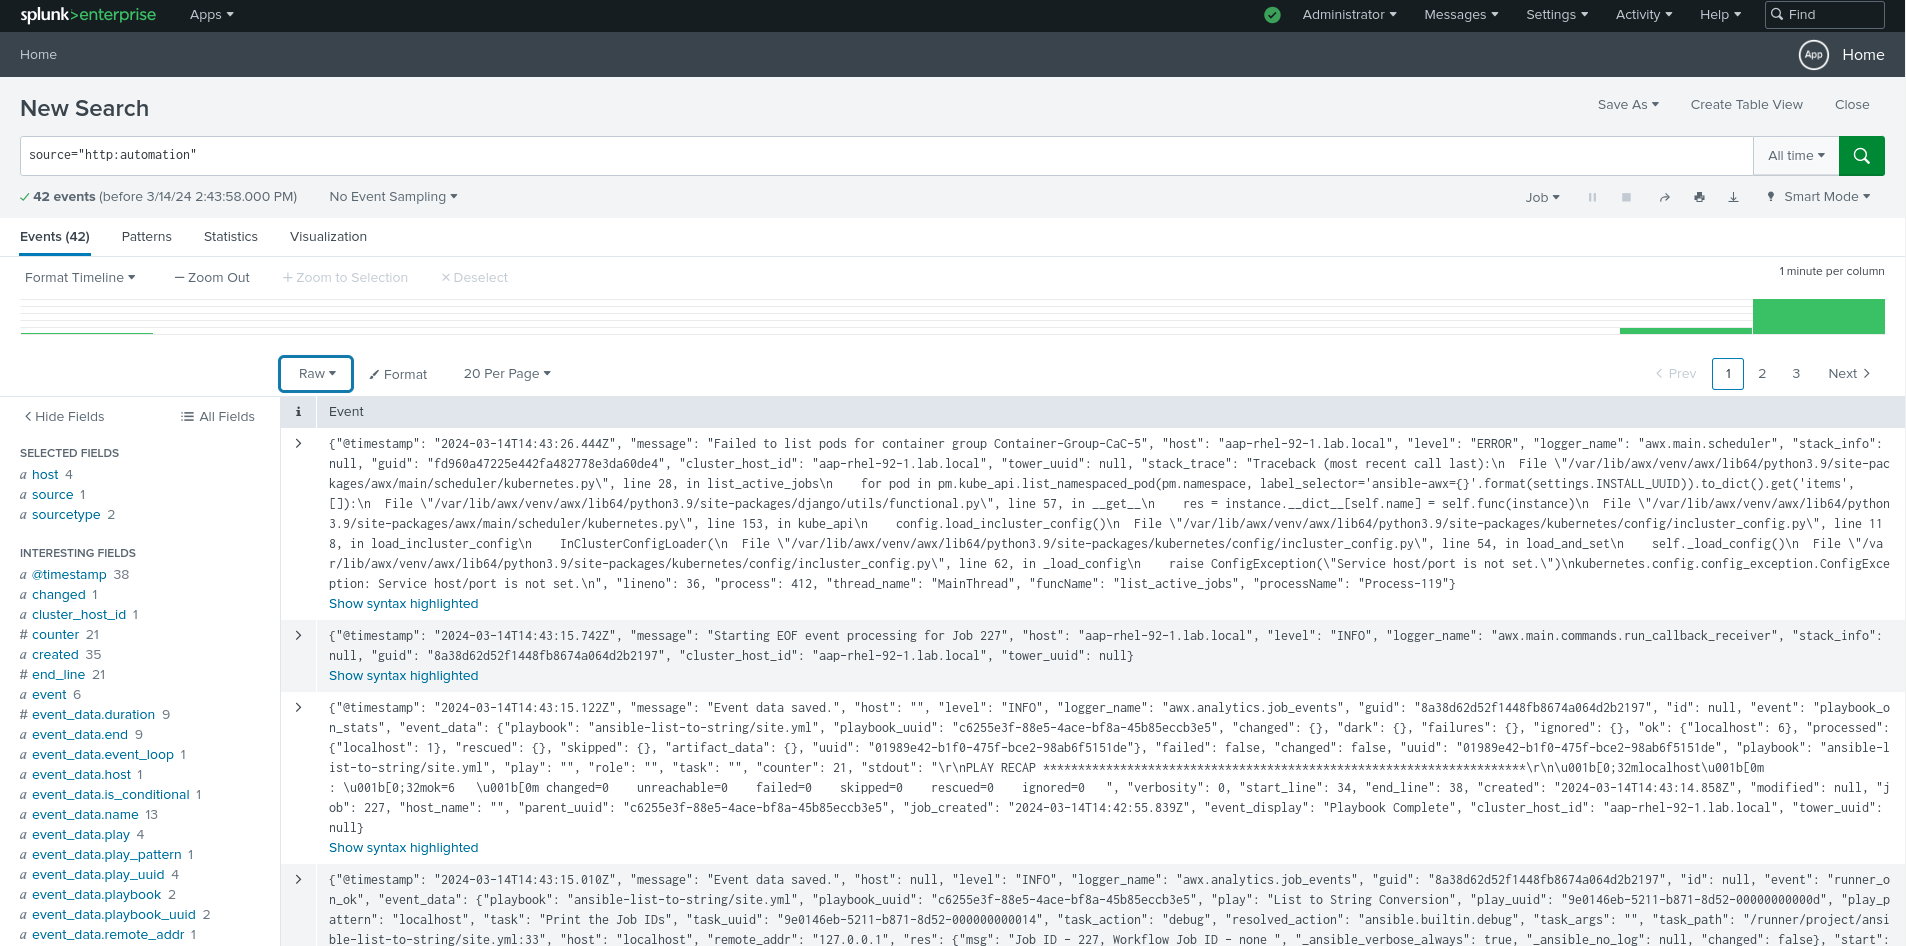
Go to Splunk’s search interface and you should see the job history and other activity logs from the Automation Controller.
Customization and Further Reading
You can configure what specific logs you want to send to Splunk by referring to the Ansible Automation Controller documentation .
Troubleshooting
In real scenarios, there will be situations with connectivity issues and Splunk authentication issues. You can check the logs to understand if any such issues when you have difficulty getting events.
If the Ansible Automation Platform is running on top of OpenShift, then you can check the logs as follows.
# oc logs -f automation-controller-6b77d7f56c-gn9dp automation-controller-rsyslog
# oc logs -f automation-controller-6b77d7f56c-gn9dp automation-controller-task
# oc logs -f automation-controller-6b77d7f56c-gn9dp automation-controller-web
If your Ansible Automation Platform is running on top of VM(s) or as a Containerized Ansible Automation Platform , then you can use the standard journalctl as follows.
$ sudo journalctl -f CONTAINER_NAME=automation-controller-rsyslog
In the below snippet, I am checking the automation-controller-rsyslog container (I am running a Containerized Ansible Automation Platform , hence using the Podman containers) logs and filter with the Splunk IP address 192.168.57.11 (which I have configured wrongly to demonstrate the scenario).
$ sudo journalctl -f CONTAINER_NAME=automation-controller-rsyslog |grep 192.168.57.11
Mar 15 04:10:27 aap-rhel-92-1.lab.local automation-controller-rsyslog[1514]: rsyslogd: omhttp: suspending ourselves due to server failure 7: Failed to connect to 192.168.57.11 port 8088: No route to host [v8.2102.0-13.el8 try https://www.rsyslog.com/e/2007 ]
Mar 15 04:10:30 aap-rhel-92-1.lab.local automation-controller-rsyslog[1514]: rsyslogd: omhttp: suspending ourselves due to server failure 7: Failed to connect to 192.168.57.11 port 8088: No route to host [v8.2102.0-13.el8 try https://www.rsyslog.com/e/2007 ]
Mar 15 04:10:33 aap-rhel-92-1.lab.local automation-controller-rsyslog[1514]: rsyslogd: omhttp: suspending ourselves due to server failure 7: Failed to connect to 192.168.57.11 port 8088: No route to host [v8.2102.0-13.el8 try https://www.rsyslog.com/e/2007 ]
Mar 15 04:10:36 aap-rhel-92-1.lab.local automation-controller-rsyslog[1514]: rsyslogd: omhttp: suspending ourselves due to server failure 7: Failed to connect to 192.168.57.11 port 8088: No route to host [v8.2102.0-13.el8 try https://www.rsyslog.com/e/2007 ]
Mar 15 04:10:39 aap-rhel-92-1.lab.local automation-controller-rsyslog[1514]: rsyslogd: omhttp: suspending ourselves due to server failure 7: Failed to connect to 192.168.57.11 port 8088: No route to host [v8.2102.0-13.el8 try https://www.rsyslog.com/e/2007 ]
Mar 15 04:10:43 aap-rhel-92-1.lab.local automation-controller-rsyslog[1514]: rsyslogd: omhttp: suspending ourselves due to server failure 7: Failed to connect to 192.168.57.11 port 8088: No route to host [v8.2102.0-13.el8 try https://www.rsyslog.com/e/2007 ]
Mar 15 04:10:46 aap-rhel-92-1.lab.local automation-controller-rsyslog[1514]: rsyslogd: omhttp: suspending ourselves due to server failure 7: Failed to connect to 192.168.57.11 port 8088: No route to host [v8.2102.0-13.el8 try https://www.rsyslog.com/e/2007 ]
^C
This is a basic setup to get you started. Splunk and Ansible offer many advanced features for customization and deeper analysis. By following these steps, you’ll have Ansible Automation Controller logs flowing into Splunk, giving you valuable insights into your automation processes and overall infrastructure health.
Troubleshooting and guides
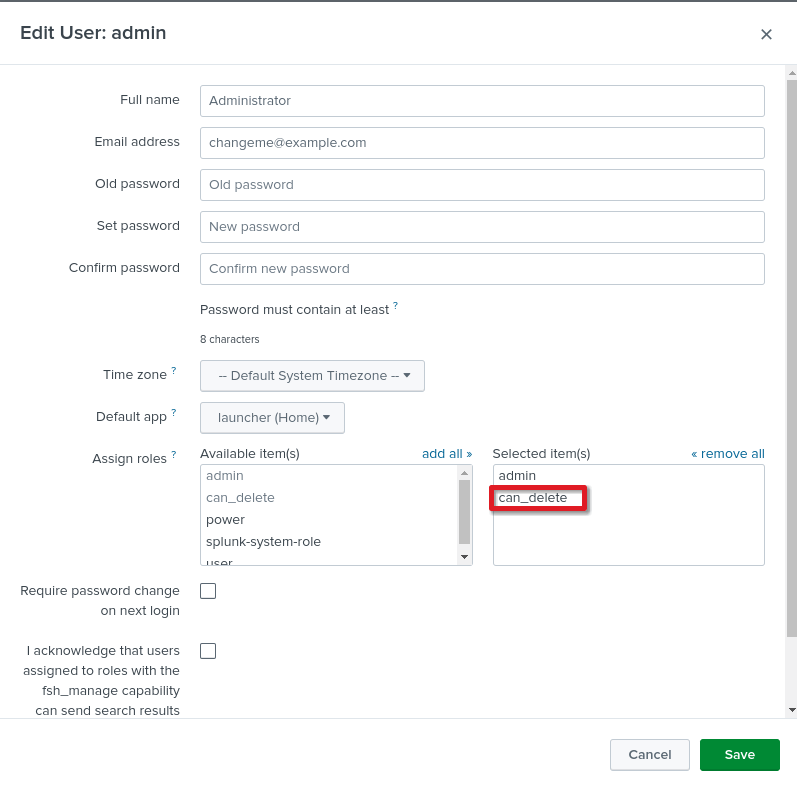
The ansible controller will be sending a lot of events and you may want to housekeep your Splunk server accordingly. In my lab environment, I will delete the old events but I need to allow the user with can_delete permission as even the admin user doesn’t have that permission.
Goto Settings -> Users and Edit the User account you want to assign can_delete permission as follows.
source="http:automation" | delete
Be careful with the delete operation as it is not supposed to use in production environment without proper planning.
Gineesh Madapparambath
Gineesh Madapparambath is the founder of techbeatly. He is the co-author of The Kubernetes Bible, Second Edition and the author of Ansible for Real Life Automation. He has worked as a Systems Engineer, Automation Specialist, and content author. His primary focus is on Ansible Automation, Containerisation (OpenShift & Kubernetes), and Infrastructure as Code (Terraform). (Read more: iamgini.com)
Note
Disclaimer: The views expressed and the content shared in all published articles on this website are solely those of the respective authors, and they do not necessarily reflect the views of the author’s employer or the platform. We strive to ensure the accuracy and validity of the content published on our website. However, we cannot guarantee the absolute correctness or completeness of the information provided. It is the responsibility of the readers and users of this website to verify the accuracy and appropriateness of any information or opinions expressed within the articles. If you come across any content that you believe to be incorrect or invalid, please contact us immediately so that we can address the issue promptly.