

AWS / Cloud / Docker / How To / Kubernetes
Setup Amazon Managed Service for Grafana (AMG) on AWS EKS
https://aws.amazon.com/grafana/
Based on the previous article of setting up Amazon Managed Service for Prometheus (AMP) with open source Grafana , we will now be provisioning Amazon Managed Grafana to integrated with Amazon Managed Service for Prometheus in this walkthrough.
Amazon Managed Grafana is a fully managed service for open source Grafana developed in collaboration with Grafana Labs. Grafana is a popular open source analytics platform that enables you to query, visualize, alert on and understand your metrics no matter where they are stored.
With Amazon Managed Grafana, you can analyze your metrics, logs, and traces without having to provision servers, configure and update software, or do the heavy lifting involved in securing and scaling Grafana in production.
Connect Amazon Managed Grafana to multiple data sources in your observability stack, including AWS data sources like Amazon Managed Service for Prometheus, Amazon CloudWatch, and Amazon Elasticsearch Service, third-party ISVs like Datadog and Splunk, and self-managed data sources like InfluxDB.
Amazon Managed Grafana (AMG) is Generally Available on Aug’2021.

Step1: Create Amazon Managed Service for Grafana (AMG) workspace
- Go to AWS Console > Amazon Managed Service for Grafana (AMG) > create workspace
- Enter a workspace name eg. Grafana-Workspace
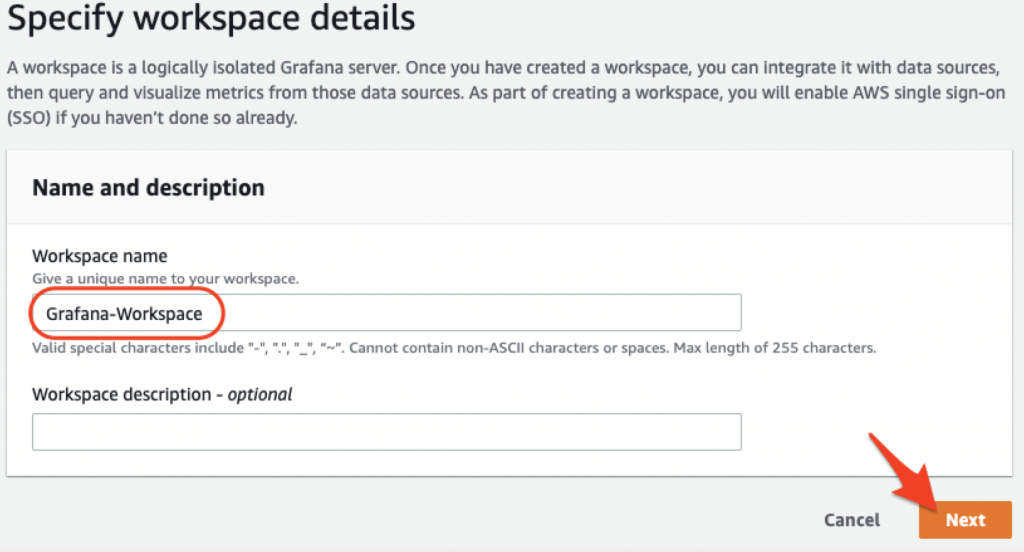
- Enable AWS SSO Single Sign-On (SSO)
- From the current account , Select all datasources support by the services and also Amazon SNS for notifications. After reviewing all the selections created, Click ‘Create workspace‘
Step2: Assign users to access the new created AWS Managed Grafana workspace
- After the Grafana has been created, assign users to access the Grafana portal
- Click on ‘Assign new user or group’ under AWS Single Sign-On (SSO)
- Select the user(s) to allow access to Grafana.
- Once users has been granted access from previous step, they can access the AWS Managed Grafana workspace URL:
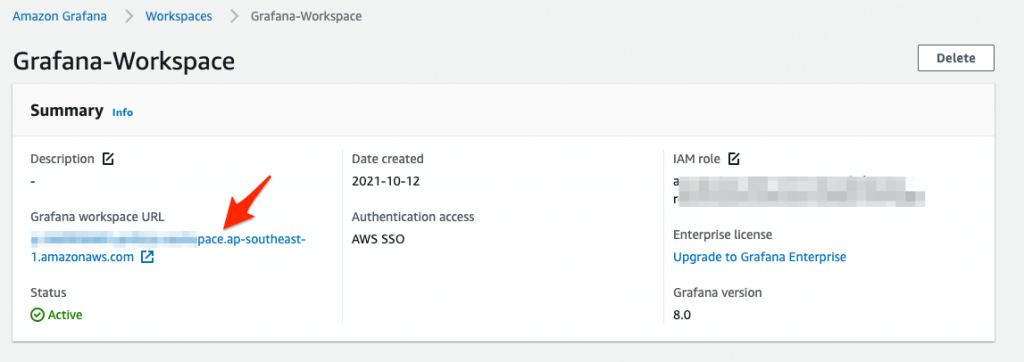
- From the Grafana workspace URL, the user can access the portal redirected signing in via AWS SSO
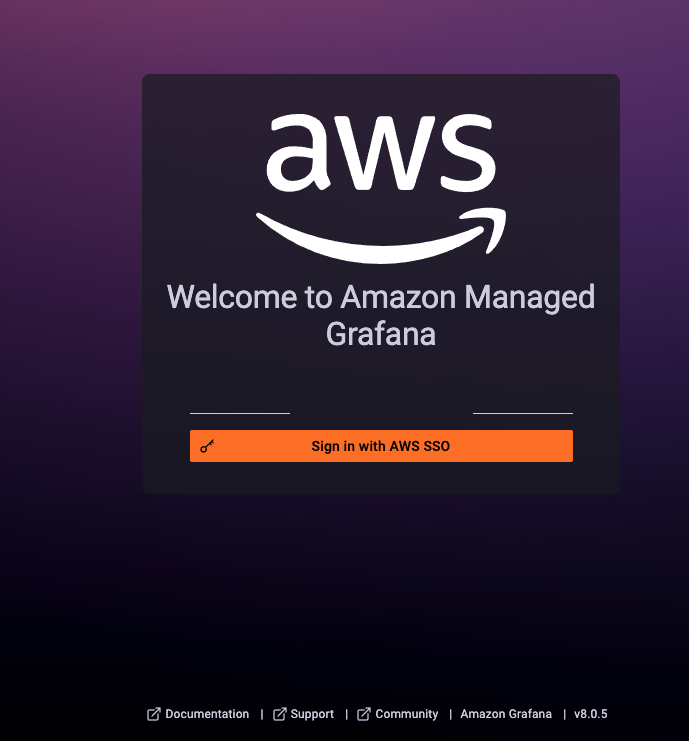
Now you have access to AWS Managed Grafana !!
Step3: Configure Amazon Managed Service for Prometheus (AMP) as data source in AWS Managed Service Grafana
To monitor specific AWS EKS cluster, you will need to setup AWS managed Prometheus before using AWS Managed Service Grafana.
- Before we can visualise the metrics in Grafana, its has to be configured with 1 or more data sources. Lets specify the workspace within Amazon Managed Service for Prometheus (AMP).
- Grafana Configurations > Data Sources > Select Prometheus as data source
2. Input the AWS AMP Workspace query URL under HTTP/URL
3. Turn on SigV4 auth
4. Change default region of the AMP and AWS EKS cluster resides in
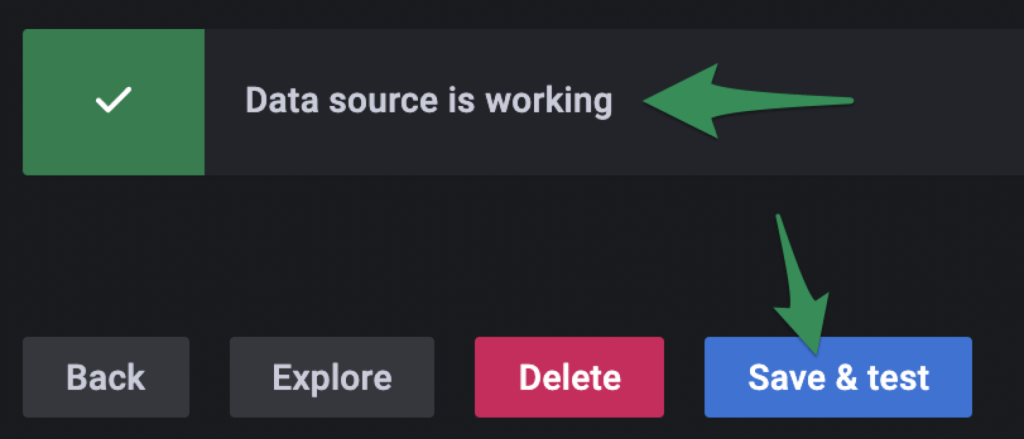
5. Lastly, Save & Test the data source. (Ensure the tick and Data source is working)
Step4: Deploy dashboard to monitor our workload in AWS EKS Cluster
- On the main page of Grafana login, lets add in some default dashboard by selecting Import:
- Input ‘3119’ and press Load [ Kubernetes cluster monitoring (via Prometheus) ]
- Then select Prometheus > Import


You are done for the day !!

References:
- https://docs.aws.amazon.com/grafana/latest/userguide/what-is-Amazon-Managed-Service-Grafana.html
Disclaimer:
The views expressed and the content shared in all published articles on this website are solely those of the respective authors, and they do not necessarily reflect the views of the author’s employer or the techbeatly platform. We strive to ensure the accuracy and validity of the content published on our website. However, we cannot guarantee the absolute correctness or completeness of the information provided. It is the responsibility of the readers and users of this website to verify the accuracy and appropriateness of any information or opinions expressed within the articles. If you come across any content that you believe to be incorrect or invalid, please contact us immediately so that we can address the issue promptly.
Tags:
Latest posts


Comments
Leave a Reply